

top
ZEEL - Base Building, Wedge Support Meets Improving Fundamentals
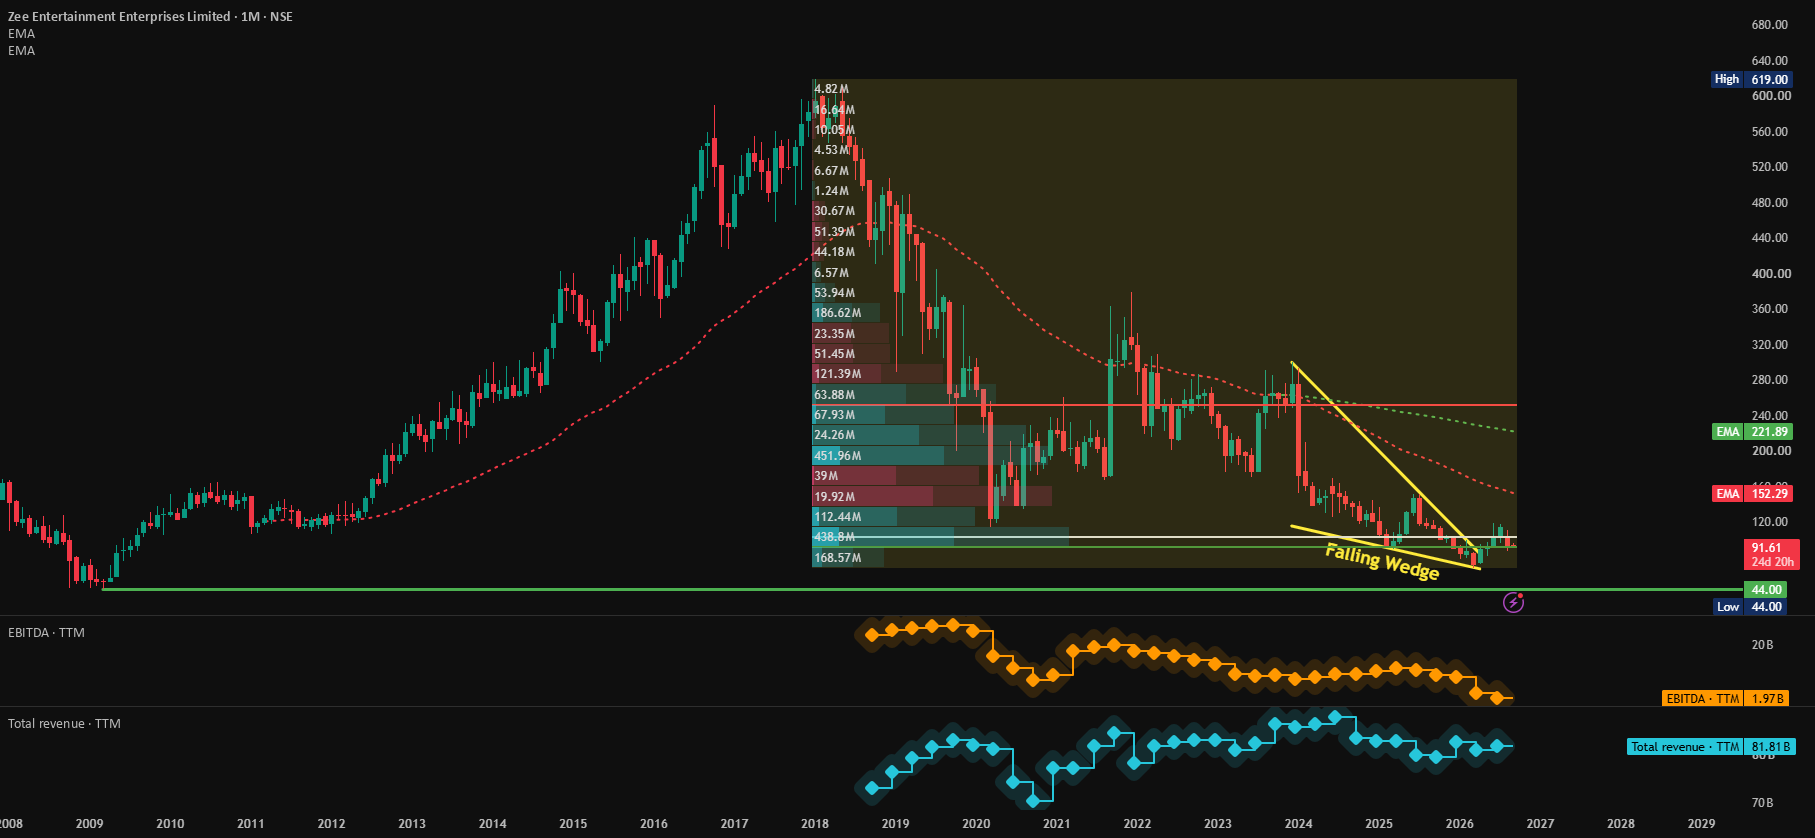
Overview Zee Entertainment is trading at 91.61, down 2.11%, still a fraction of its 2018 all-time high of 619.00. After one of the sharpest, most prolonged falls in the large-cap media space, the stock has been trading sideways at deeply depressed levels for the last couple of years. This long-term view looks at both the chart pattern and the company's underlying numbers to build a fair, honest picture of where things stand right now. Technical Structure Looking at the monthly chart, the volume profile (a tool that shows how much trading activity happened at each price level) reveals something interesting: most of the heavy trading activity has now shifted down into the current price zone (roughly 90–250), rather than the much higher levels where the stock used to trade. When trading activity settles into a lower zone like this over time, it often means the market has slowly found a new "comfort zone" for the price, rather than still being in freefall. Within this zone, price has been forming a falling wedge over the past couple of years, a pattern where price makes lower highs and lower lows, but the two boundary lines are slowly squeezing closer together. Falling wedges usually lean bullish once price breaks above the upper line. Right now, price is testing the wedge's lower boundary, close to a long-standing support zone near 90–120. Fundamental Turnaround Signals (In Simple Words) At the whole-company level, according to TradingView data, Zee's total revenue over the last 12 months (referred to as TTM, or "trailing twelve months") stands at ₹81.81 billion, with EBITDA (a measure of how much the core business earns before interest, taxes, depreciation, and amortization, basically a rough measure of operating profitability) at ₹1.97 billion. That's a thin margin, but a real improvement compared to the deeper losses seen in recent years. To understand what's driving this improvement, it helps to look at just one part of the business: ZEE5, the company's streaming platform. According to data referenced from Screener.in, ZEE5's losses have shrunk dramatically, from -₹11,054 million in FY23 to just -₹490 million in FY26, while its revenue has grown to ₹14,888 million, up sharply from ₹9,760 million the year before. In simple terms, the streaming business used to lose a huge amount of money every year, and that loss has now shrunk to almost nothing, while it's also making more money than before. This tells us the overall company-level improvement is being driven largely by streaming finally getting closer to breakeven, not just cost-cutting elsewhere. The Risk That Remains: Promoter Legal Overhang This isn't a "clean" story, and it's important to be upfront about that. In July 2026, market regulator SEBI passed a final order finding former promoters Subhash Chandra and Punit Goenka guilty of a fraudulent scheme related to an unauthorized 2018 property pledge, and debarred both of them from the securities market for 12 months, while restraining the company itself for two months, along with financial penalties. The company and Goenka have since gone to the Securities Appellate Tribunal (SAT), which partly relaxed these restrictions, notably allowing a large promoter-backed fundraise (over ₹3,000 crore) to go through. This legal matter is still under appeal and isn't fully resolved, so it remains a genuine risk and a possible source of negative headlines going forward. Key Levels Long-Term Resistance Zone: 240–280 (a ceiling the stock has struggled to clear for years) Wedge/Horizontal Support: 90–120 Invalidation: A sustained close below 44 (the multi-year low) would be a serious warning sign Long-Term Target Zone (if the wedge breaks upward): 240, then 400+ over a longer time horizon Scenarios Bullish: If price holds the current wedge support and breaks above the wedge's upper line with strength, combined with ZEE5 continuing to improve, it would support a longer-term "base-building" story, with 240 as the first meaningful long-term target. Bearish/Cautious: If the legal situation worsens, or price breaks clearly below the 90 support zone, this base-building idea would be in doubt, and the stock could stay range-bound or fall further, even with the fundamental improvements. Beginner's Lesson A stock can genuinely be improving on the inside (like ZEE5 nearing breakeven) while still carrying real risk from the outside (like an unresolved legal case against former promoters). These two things aren't contradictory, they're simply two different layers of the same story, and good analysis means acknowledging both rather than only focusing on the one that fits a particular view. Volume profile shifting to lower price zones over time is a similar idea: it doesn't guarantee a bottom is in, but it shows where real buying and selling interest has built up, which can act as a meaningful support zone going forward. Financial Terms Explained EBITDA: Earnings Before Interest, Taxes, Depreciation, and Amortization. A way of measuring how profitable the core business is, before accounting for things like loan interest or accounting write-downs. TTM (Trailing Twelve Months): The total figure for the most recent 12-month period, updated continuously rather than waiting for a full financial year to end. Volume Profile: A chart tool showing how much trading activity happened at each price level, helping identify zones of strong buying/selling interest. Falling Wedge: A chart pattern where price makes lower highs and lower lows within two converging downward-sloping lines, generally seen as a bullish pattern once broken to the upside. Conclusion Zee Entertainment presents a genuinely mixed long-term picture: a falling wedge testing support at a zone with heavy historical trading activity, paired with real improvement in its streaming business, but still under the shadow of an unresolved legal matter involving its former promoters. This isn't a finished turnaround story yet, it's a developing one, best watched closely rather than acted on with full conviction until either the chart confirms a breakout or the legal situation meaningfully clears up. Company financial data referenced from TradingView (consolidated figures) and Screener.in (segment-level ZEE5 figures). This is for educational purposes only and not investment advice. Please do your own research or consult a financial advisor before making any trading decisions.
Read full article on Tradingview
Related News