

top
Vedanta cmp 283 Daily Chart
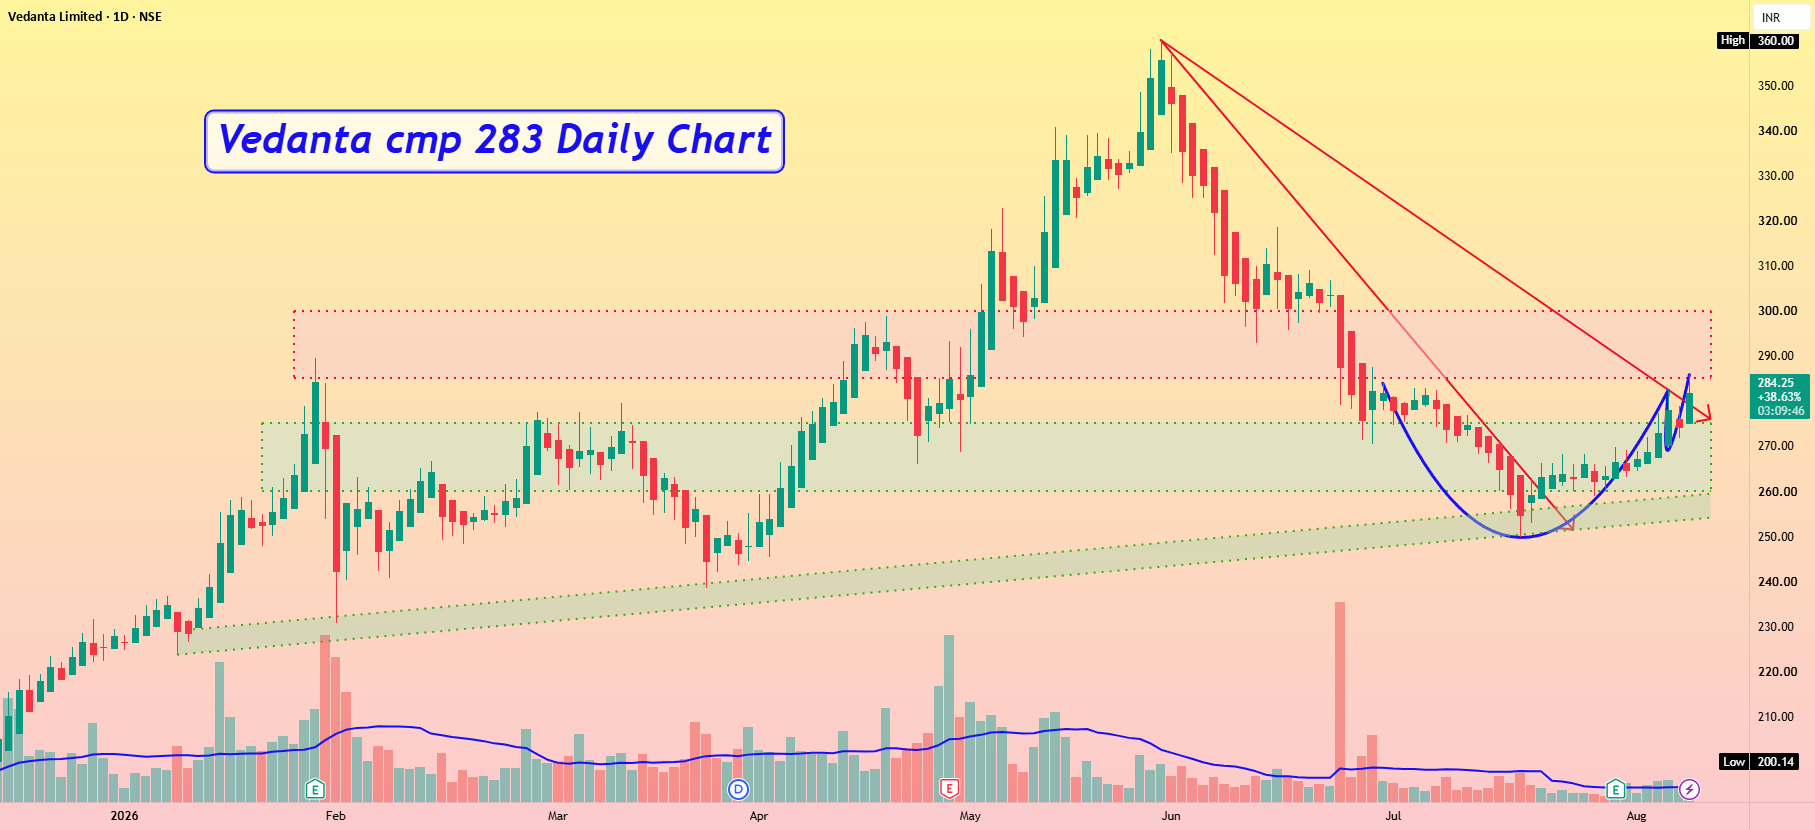
Vedanta cmp 283 Daily Chart - Support Zone 260 to 2755 Price Band - Resistance Zone 285 to 300 Price Band - Cup & Handle made around Support Zone - Volumes in good good sync of avg traded qty - Support Zone strength indicates uptrend probability - Price is shouldering along the Rising Support Trendline - 1st Breakout Resistance Trendline done, 2nd is attempted - Price trending along High Higher High Lower High closure
Read full article on Tradingview
Related News


