

business
EMS Ltd cmp 383.10 Weekly Chart since listed
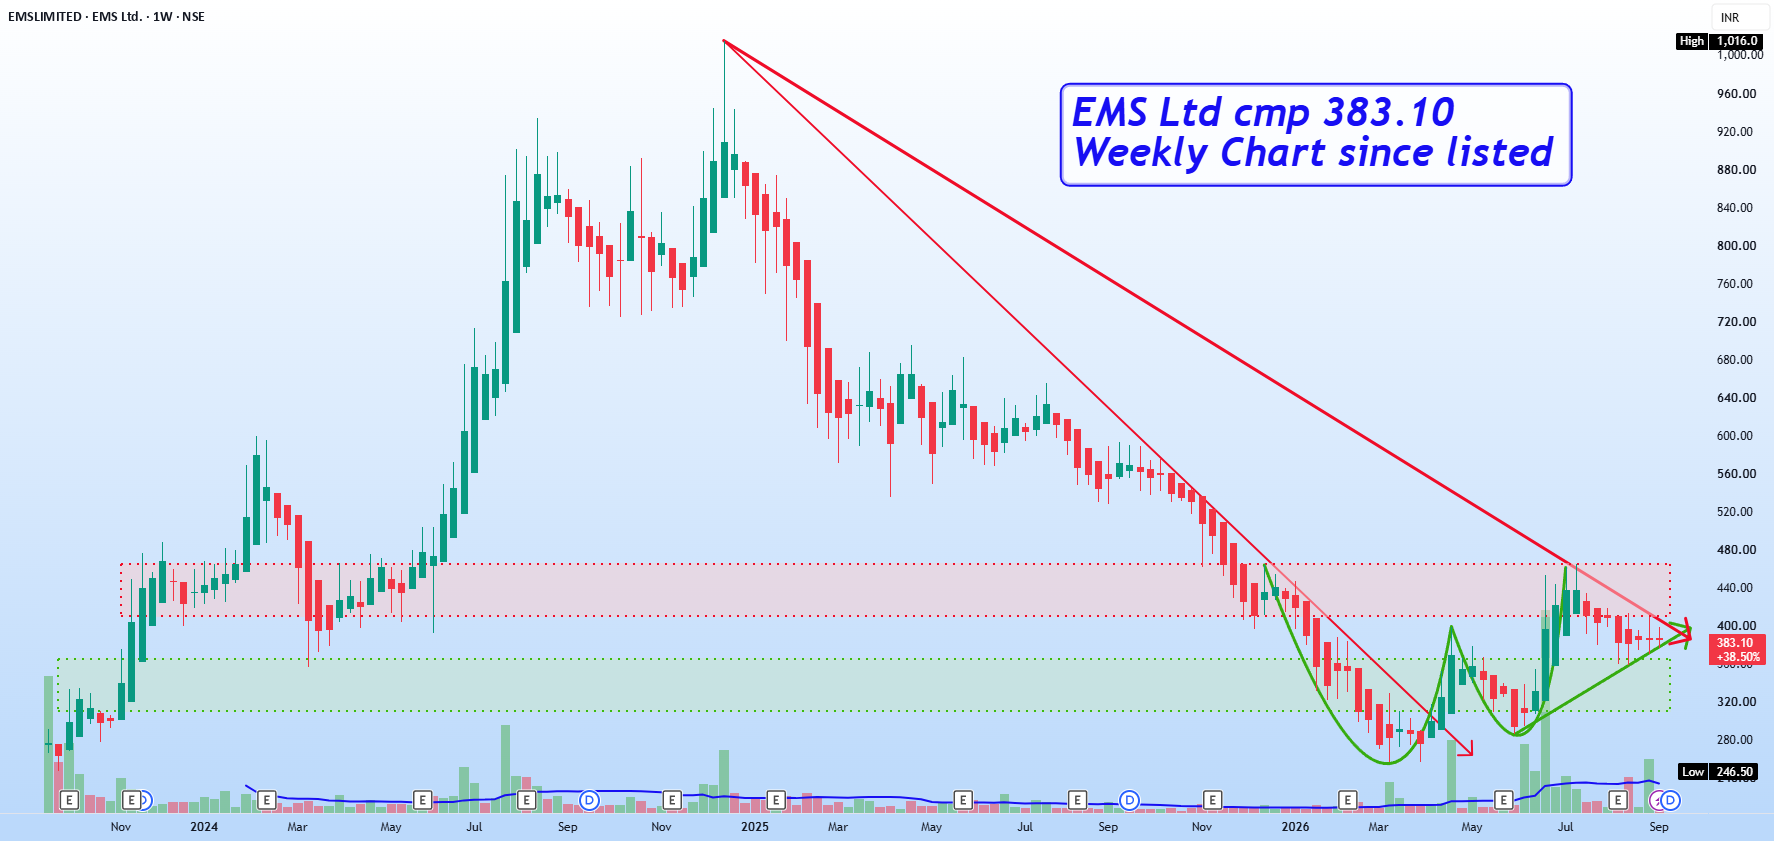
EMS Ltd cmp 383.10 Weekly Chart since listed - Support Zone 310 to 365 Price Band - Resistance Zone 410 to 465 Price Band - 1st Resistance Trendline Breakout sustained - 2nd Resistance Trendline Breakout attempted - Price shouldering along Rising Support Trendline - Price trending between Support and Resistance Zone - Doji Candles for past 3 weeks indicate Indecisive trend - Volumes spiking on alternate weeks above avg traded qty - Bullish "W" pattern formed by the Resistance Zone neckline
Read full article on Tradingview
Related News