

business
XAU/USD 45-Minute Technical Analysis
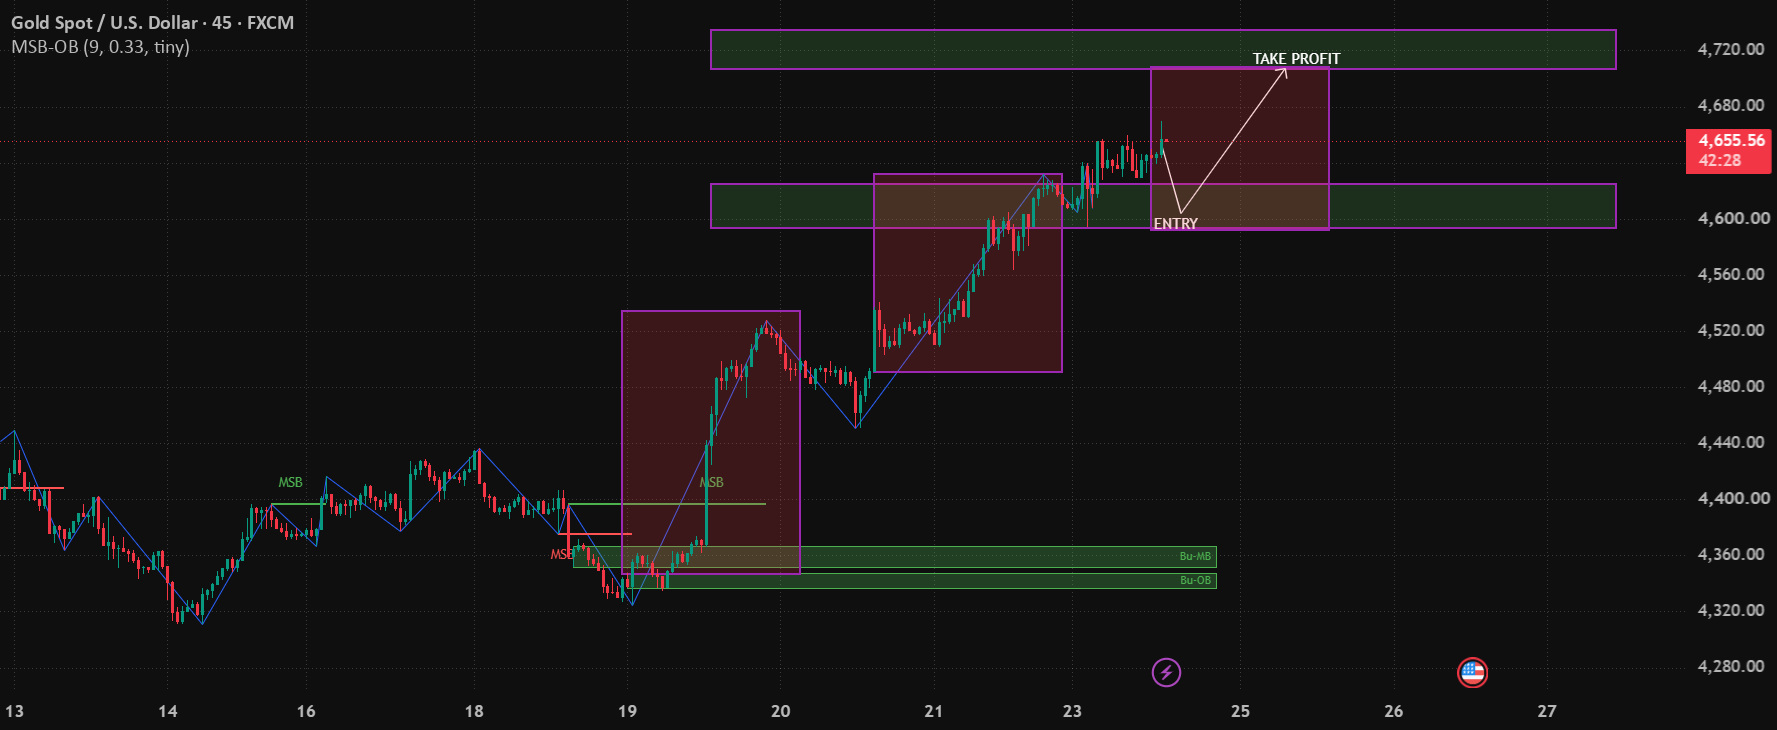
Market Structure The chart shows **Gold Spot / U.S. Dollar (XAU/USD) on the 45-minute timeframe** with a clearly developing bullish market structure. * Price has formed a sequence of **higher highs and higher lows** from the 4,320–4,350 area. * The major bullish displacement occurred after the **19th**, breaking above the previous swing structure. * Subsequent pullbacks have been relatively shallow, indicating that buyers remain in control. * Current price is around **4,657.62**, following another push toward the upper part of the recent range. ### Key Zones | Zone | Approx. Level | Significance | | ------------------------- | --------------: | ---------------------------------------- | | **Major Resistance / TP** | **4,700–4,720** | Primary upside target and supply area | | Near Resistance | **4,660–4,680** | Current price / short-term reaction area | | **Entry / Demand Zone** | **4,590–4,620** | Preferred bullish retracement area | | Deeper Support | **4,550–4,580** | Structural support if entry zone fails | | Major Demand | **4,340–4,370** | Previous accumulation / bullish base | ### Trade Idea The setup illustrated on the chart is essentially a **buy-the-dip continuation strategy**. **Preferred scenario:** 1. Price retraces into the **4,590–4,620 demand/entry zone**. 2. Buyers defend the zone. 3. A bullish rejection or lower-timeframe market-structure shift confirms the entry. 4. Price continues toward **4,680**, followed by the major target around **4,710–4,720**. The projected move from approximately **4,600 to 4,715** represents roughly **115 points of upside**. ### Stop-Loss Consideration A logical invalidation would be **below the 4,590 area**, assuming the entry is taken from the highlighted demand zone. A more conservative structural stop could sit below **4,550**, but this increases the position's required risk. The stop should therefore be selected according to the entry confirmation and position size rather than simply placing it at an arbitrary distance. ### Bullish Confirmation For the long setup to remain attractive, I would want to see: * A pullback into **4,590–4,620**. * Rejection wicks or strong bullish candles from the zone. * A break of the most recent minor swing high. * Continued higher-high/higher-low formation. * No sustained 45-minute close below the demand zone. ### Bearish Invalidation The bullish thesis weakens substantially if price: **breaks and holds below 4,590**, particularly if the 45-minute structure begins producing lower highs and lower lows. A deeper break toward **4,550** would suggest that the current bullish continuation setup has failed and that a larger corrective move may be developing. ### Target Management **TP1:** 4,680–4,690 **TP2:** 4,710–4,720 — major resistance / highlighted take-profit zone At TP1, partial profit-taking and moving the stop toward breakeven can reduce risk. The **4,700–4,720 region** is particularly important because it represents the upper supply/resistance zone shown on the chart. ## Professional Bias: 🟢 BULLISH The higher-timeframe structure visible on this chart favors **buying retracements rather than chasing price at the current high**. **Best risk/reward:** Wait for a controlled retracement into **4,590–4,620**, obtain confirmation, and target **4,700–4,720**. **Key principle:** The setup is bullish **while the 4,590 area continues to hold as support**. A decisive breakdown changes the technical picture.
Read full article on Tradingview
Related News