

business
Momentum in Motion: A Technical Look at Siemens
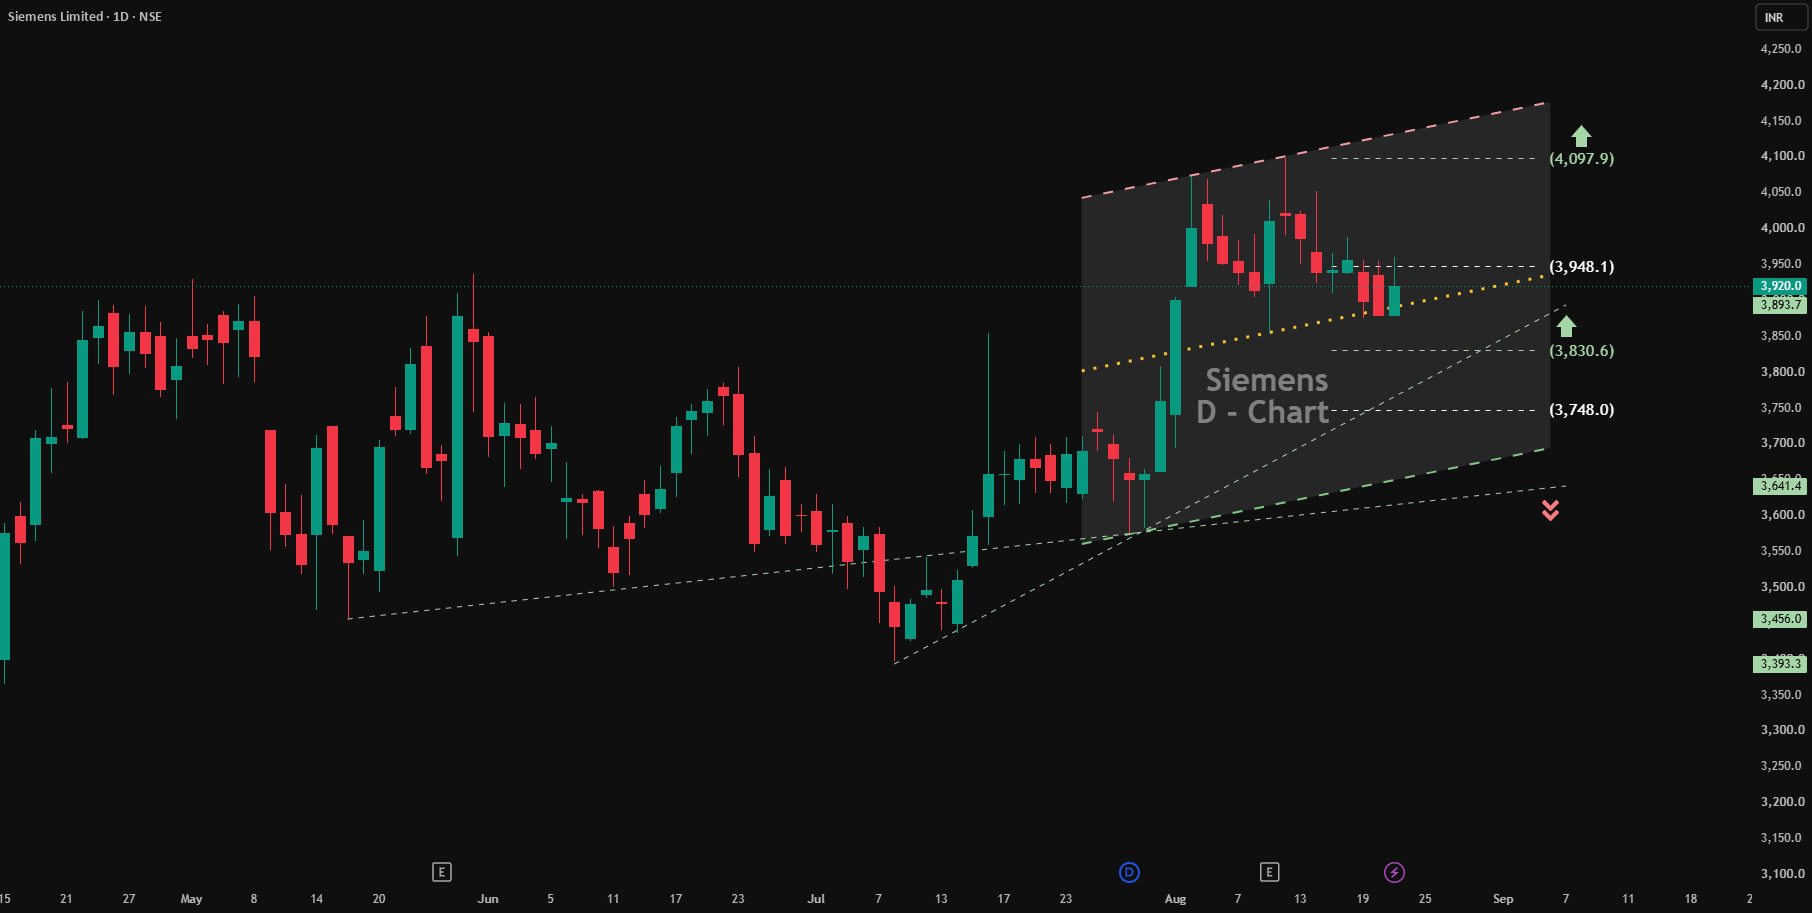
The daily chart for Siemens demonstrates a well-defined ascending channel, indicating a prevailing medium-term bullish trend. The price action is currently consolidating and testing key dynamic support and resistance zones. Trend Pattern: The stock is trading within a rising parallel channel, with higher highs and higher lows respecting the upper and lower trendline boundaries. Dynamic Support: The dotted yellow ascending trendline is currently acting as a dynamic support level, keeping the near-term bullish momentum intact. Key Support Levels: Immediate downside support is established at 3,748.0, which aligns closely with the lower boundary of the primary channel. A breakdown below this could signal a trend reversal or deeper correction. Immediate Resistance & Pivot: The 3,830.6 level acts as a critical pivot point (indicated by the directional arrows). Regaining and holding above this level is essential for bullish continuation. Upside Targets: If the price successfully pushes past the 3,948.1 near-term resistance (recent swing high), the ultimate technical target is the upper boundary of the ascending channel, projected at 4,097.9. Like... Share...Follow
Read full article on Tradingview
Related News