

business
Liquidity Sweep Before Bearish Reversal
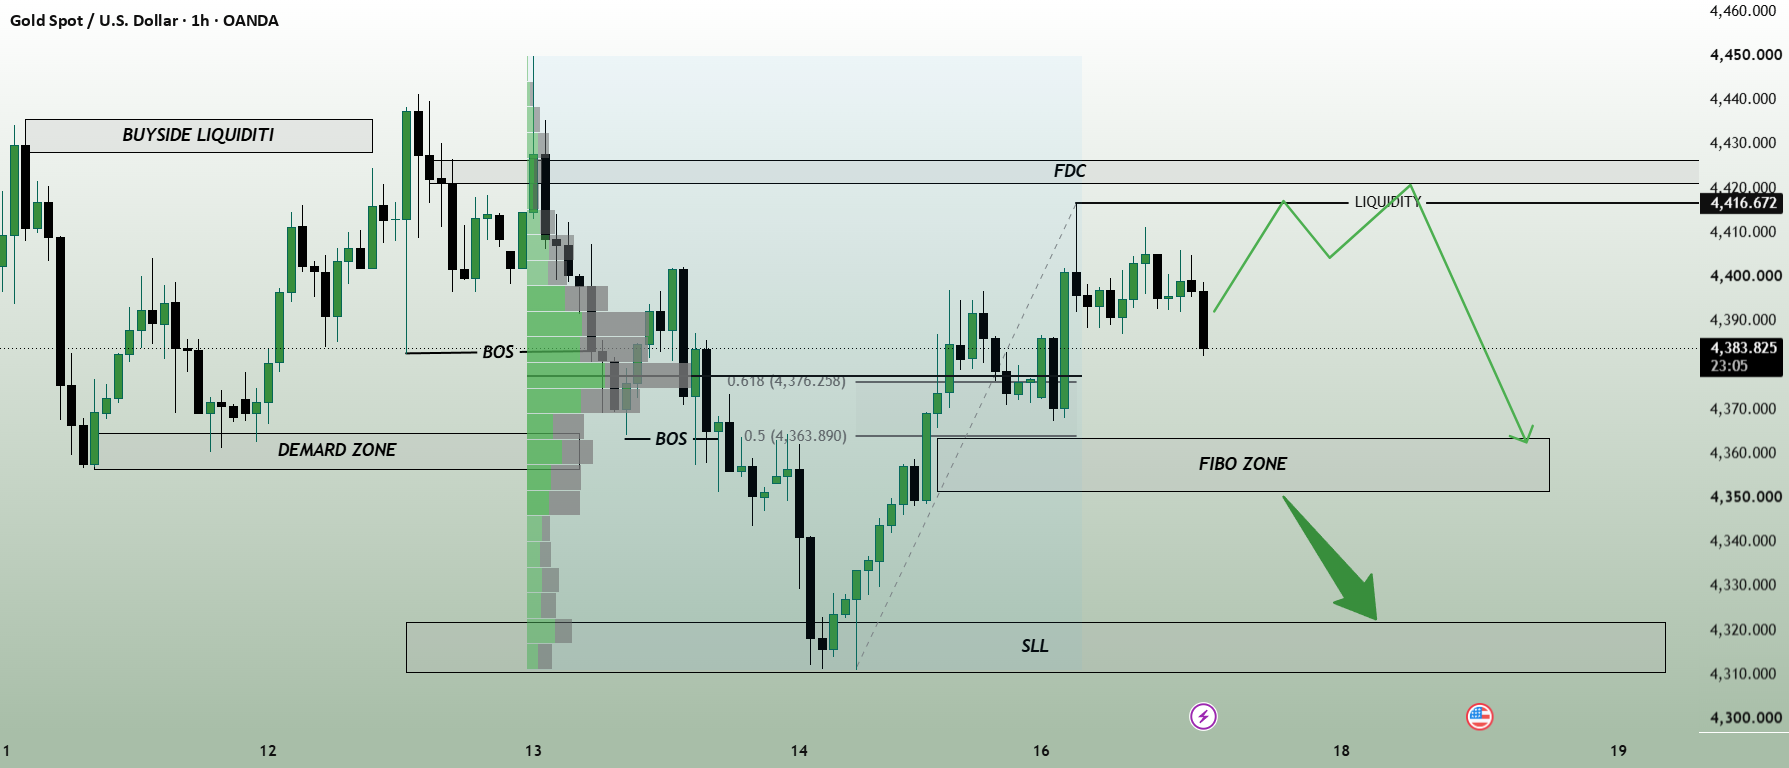
Fundamental Analysis Gold remains supported by a softer U.S. dollar and fading expectations of another near-term Fed hike. July CPI rose by only 0.1%, PPI was unchanged, while retail sales declined 0.6%, keeping pressure on U.S. rate expectations. Market attention now turns to the Fed’s July meeting minutes for further policy clues. Technical Analysis On the H1 timeframe, Gold has staged a strong recovery from the 4,310–4,320 SLL zone and reclaimed the 0.5–0.618 Fibonacci retracement area. Price is now consolidating just below the 4,416.672 buy-side liquidity and the 4,420–4,426 FDC resistance zone. The primary setup is to watch for one final bullish push into the upper liquidity area, followed by signs that sellers are stepping back in. The Volume Profile also shows significant activity around the current balance area, making the reaction around the upper liquidity zone particularly important. Key Levels 4,420–4,426 — FDC / Resistance 4,416.672 — Buy-Side Liquidity 4,376.208 — Fibonacci 0.618 4,363.890 — Fibonacci 0.5 4,350–4,364 — Fibonacci Retracement Zone 4,310–4,320 — SLL / Downside Liquidity Trading Scenario The preferred short setup would come after a liquidity sweep into 4,416–4,426, followed by a clear H1 rejection or bearish structure shift. Target: 4,350–4,364 Extended Target: 4,310–4,320 if the Fibonacci zone breaks decisively Invalidation: Sustained H1 acceptance above 4,426 Overall View Gold may still have room for one more push higher before sellers attempt to take control. For now, the key area to monitor is 4,416–4,426, where a liquidity sweep and rejection could provide the first signal for a bearish reversal. Do you expect Gold to sweep 4,420 first before the next move lower?
Read full article on Tradingview
Related News