
business
HINDUSTAN UNILEVER — Testing Triangle Support, Bullish Setup
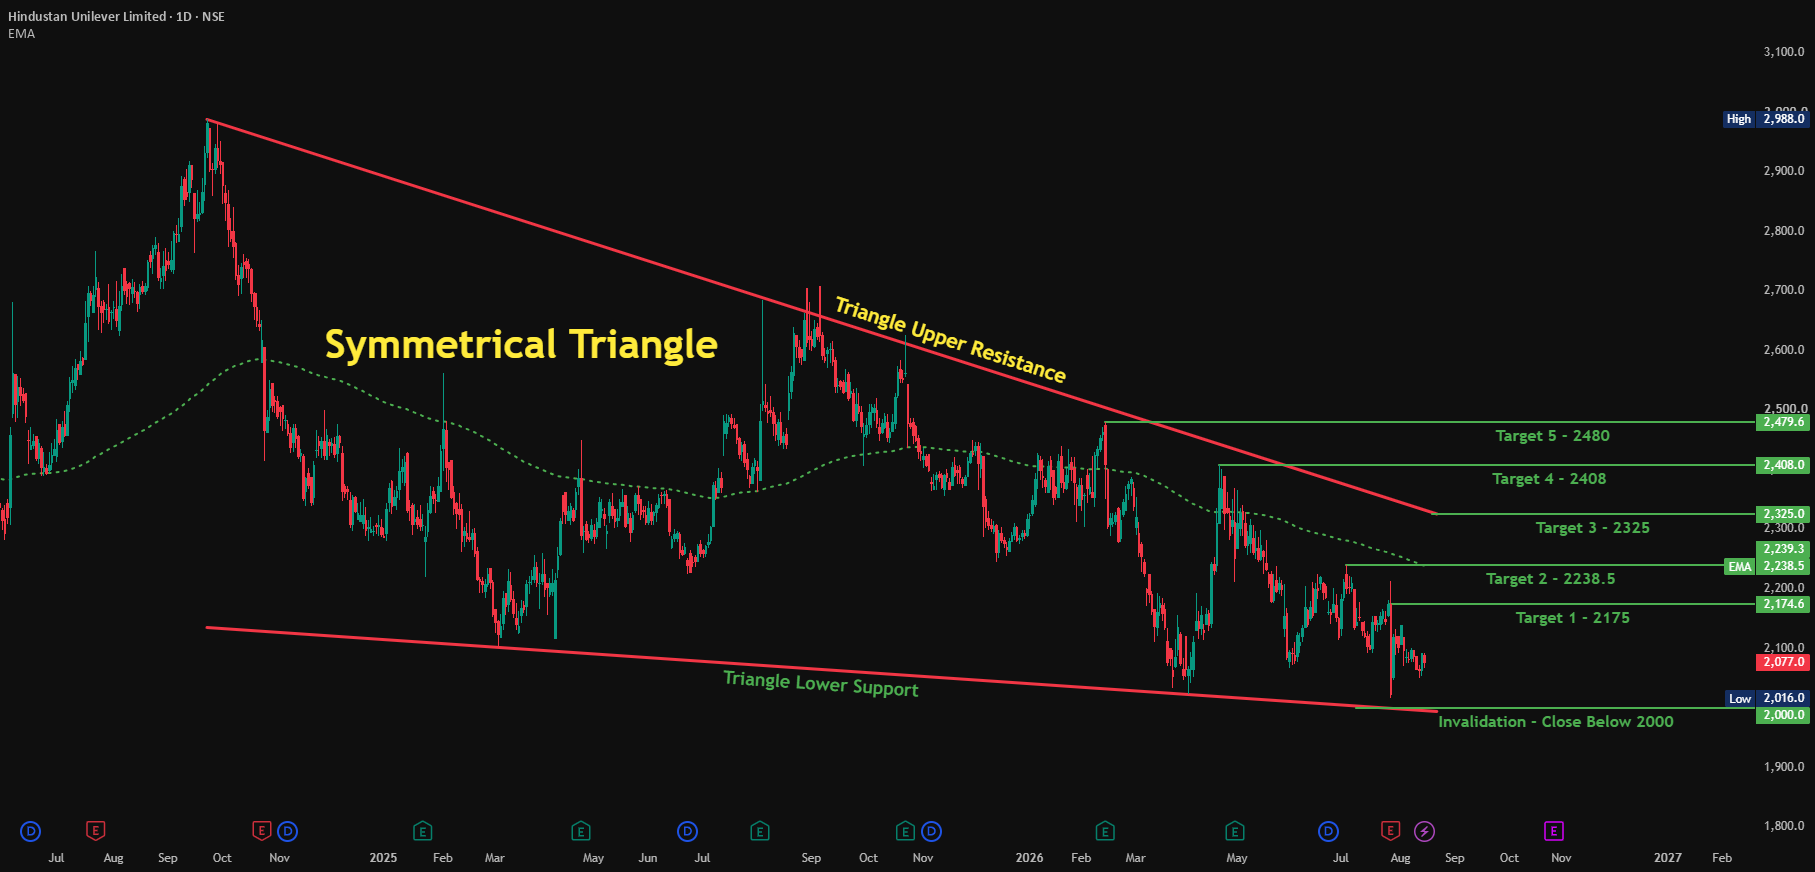
Overview Hindustan Unilever is trading at 2,077, down 0.72%, now testing the lower boundary of its 2-year symmetrical triangle. This is the same triangle covered in our earlier post, where price was watching the upper resistance zone; instead, price has drifted down and is now testing support at the opposite end of the same structure. Pattern Explanation The triangle's upper resistance line connects the October 2024 high (2,988) down through the September 2025 secondary high, converging toward the lower support line, which connects a series of rising lows since late 2024. Price is now testing this lower support again near current levels, trading below the 200 EMA (2,238.5), reflecting the recent weakness. This support zone has held on prior tests and remains the key level for a bullish reversal setup. Trade Setup Entry: Buy near current levels (2,070–2,090), on strength off triangle support Stop Loss / Invalidation: Close below 2,000 Target 1: 2,175 Target 2: 2,238.5 (200 EMA) Target 3: 2,325 Target 4: 2,408 Target 5: 2,480 (Triangle Upper Resistance) Key Levels Triangle Support / Entry Zone: 2,000–2,090 Invalidation: Close below 2,000 Target 1: 2,175 Target 2: 2,238.5 Target 3: 2,325 Target 4: 2,408 Target 5: 2,480 Beginner's Lesson In a symmetrical triangle, support and resistance testing can happen many times before the eventual breakout. A stock testing the lower boundary isn't necessarily bearish, it's simply price checking whether buyers will defend that zone again, just as it earlier tested the upper boundary and pulled back. Watching how price reacts right at this support, rather than assuming which way the triangle eventually breaks, is the key skill here. Conclusion HINDUNILVR is testing important triangle support, with the invalidation clearly marked below 2,000. A bounce from here with strength would support a bullish case through a staged target ladder up to the 2,480 zone. A close below 2,000 would invalidate this setup and suggest a deeper breakdown. This is for educational purposes only and not investment advice. Please do your own research or consult a financial advisor before making any trading decisions.
Read full article on Tradingview
Related News