

business
Asian Energy Services
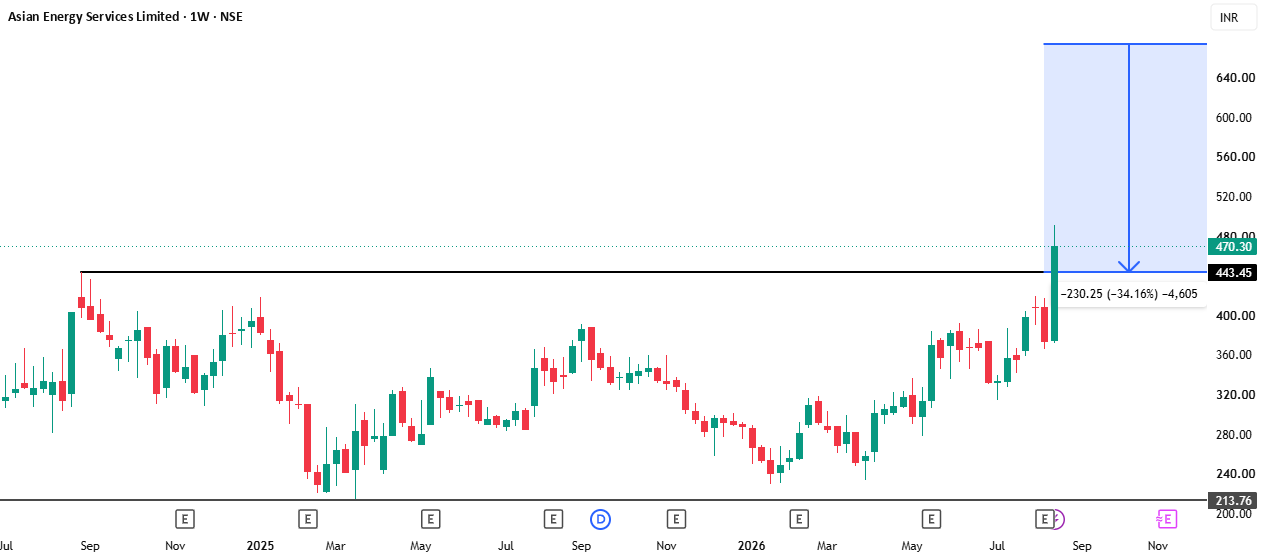
## 🚀 Asian Energy Services — BREAKOUT WITH POWER! 🔥⚡📈 **Current Price:** ₹470.30 **Weekly Gain:** **+25.61% 🚀** **Timeframe:** 1W 🔥 **This chart has finally broken out of a major resistance zone!** Asian Energy Services has delivered a massive weekly move, breaking above the long-standing **₹443–₹445 resistance** with a strong bullish candle. 🐂💥 ### 🚨 WHAT MAKES THIS SETUP INTERESTING? 🟢 **₹443.45 resistance broken** 🔓 🟢 Weekly candle showing strong momentum 💪 🟢 Price has moved out of a multi-month consolidation structure 🟢 Higher highs + higher lows developing 📈 🟢 Breakout comes after a long base-building phase 🏗️ 🟢 **+25.61% weekly move** — serious momentum! 🚀🔥 The most important development is the move above **₹443–₹445**. This was a major ceiling on the chart, and price has now pushed decisively through it. 👀 ### 🎯 POSSIBLE UPSIDE ZONES If ₹443–₹445 holds as support: ➡️ **₹480–₹500** — immediate zone 🎯 ➡️ **₹520–₹550** — next momentum area 🚀 ➡️ **₹600** — major psychological level 🔥 ➡️ **₹640–₹650** — larger upside zone 🎯 **₹680–₹690** — chart projection area The marked chart projection points toward approximately **₹675–₹680**, but that would be a larger-term technical objective, not an instant target. 📊 ### 🛡️ LEVELS TO WATCH 🔑 **₹443–₹445** — KEY breakout zone 🟡 **₹420–₹430** — first pullback support 🟠 **₹380–₹400** — secondary support 🛡️ **₹350–₹360** — important structure zone ### 👀 THE BIG QUESTION NOW... After a **25%+ weekly explosion**, the stock is definitely extended in the short term. 😮💨🔥 So instead of chasing the green candle, watch how price behaves around **₹443–₹445**. 💥 Breakout → 🔄 Retest → 🟢 Hold → 🚀 Continuation That would be the ideal bullish sequence. If ₹443 turns into support, the breakout becomes much more convincing. 💪🐂 If price quickly falls back below the breakout zone, then caution is needed. ⚠️ ### 🧠 CHART VERDICT **Long consolidation 🏗️ → resistance breakout 🔓 → explosive momentum 🚀 → price discovery begins 🔥** 🐂 **Bulls have taken control.** **Bias: 🟢 BULLISH ABOVE ₹443–₹445** > 💡 **₹443 was the wall. Now let's see if it becomes the floor.** 🔥📈🎯 ⚠️ *Technical view based only on the chart. Not financial advice. Manage risk and position size.* A useful next step is to watch the **₹443–₹445 retest** closely; that zone can tell you whether this is a genuine breakout or a short-term spike.
Read full article on Tradingview
Related News